Tuesday, 11 November 2014

Barclays (BARC) ... stars aligning?

Tuesday 11th November 2014

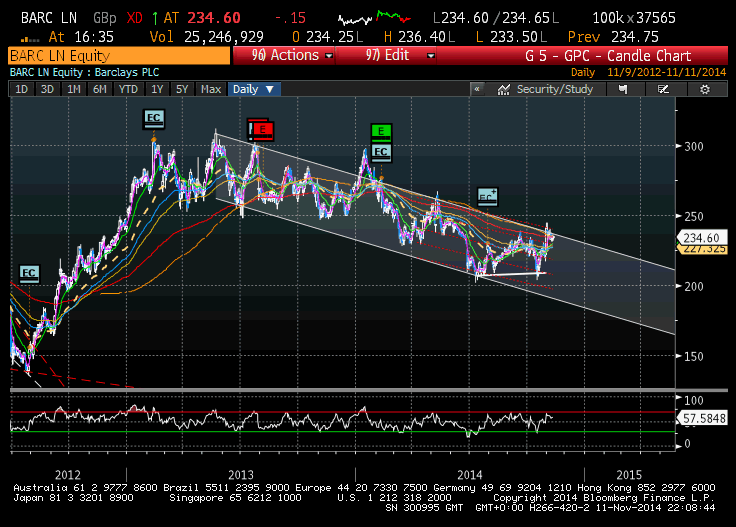
Pursuant to an inspection of the Barclays (BARC LN) share chart, I bought a few November 245p calls for a penny. 

Over in the US, JP Morgan (JPM US), Goldman Sachs (GS US), Citigroup (C US) et al have rallied sharply over recent weeks. By contrast, the UK/Euro names remain in a funk. Relative valuations may pave the way for a sharp bounce in BARC. That said, this may have to wait for the forthcoming regulatory assault on December 16th 2014 when the Bank of England publishes the results of its stress test of the British banking system.   

Nonetheless, chart wise, I reckon this to be an interesting level on BARC; with the stars beginning to align. 

It's currently sat on its 200 day moving average, teasing to potentially break above this and out of its down channel; prevalent since July 2013. The nearer term moving averages are also beginning to turn up, with the prospect of a Golden Cross coming into play. 260p near term looks likely.  

While the UK banking scene continues to go through its trials and tribulations, in terms of current valuations, BARC is certainly the cheapest amongst its peers. It trades on a price to book value of 0.64x as compared to peers ranging from 0.82x (Citigroup) to 1.26x (Goldman Sachs & Lloyds). 

Similarly on a forward P/E basis, it's also the cheapest of the bunch. 

By contrast, it currently yields the highest dividend, whilst offering one of the highest prospective yields during the next few years.

Overall, any break higher may not come in time for November 21st, but November 245 calls at a penny were enticing enough to place a small wager on the technicals prompting a run up.   

BARC - share price
Source: Bloomberg
Barclays relative to Goldman Sachs
Source: Bloomberg
Barclays price to book relative to peers
Source: Bloomberg
Barclays forward P/E relative to peers
Source: Bloomberg
Barclays prospective dividend yield relative to peers
Source: Bloomberg
Disclaimer: The information, discussions or topics referred to on this blog should in no way be considered “advice” to buy or sell anything. The information which may be referred to is freely available in the public domain and where required the source of information is referenced to for verification. While every effort has been made to ensure the veracity of any information contained within this blog, the author accepts no responsibility for the accuracy of any information contained within this blog or for the sources of information which may be referred to. Readers are responsible for their own actions and interpretation of the information contained within this blog. 

Wednesday, 5 November 2014

Avanti (AVN) ... questionable quality of sales

Wednesday, 5th November 2014


  • 2014 revenue rose by $33.5 million. 
  • 37% of this is related to sales of kit.
  • 28% of this is related to sales where the full cash amount will not be recovered for five years.
  • 65% of the 2014 sales increase appears to be related to kit sales and bandwidth or other whereby the full cash amount for the latter is unrecoverable for five years. 
  • 48% of the original current trade receivables balance appears to be either provisioned as impaired or acknowledged to not be fully recoverable. 
  • The group still plans to raise a further $125 million in debt and another $100 million in junior finance.
I remain short Avanti.


Avanti's 2014 accounts were released yesterday and while the group's year end statement (from September 15th 2014) revealed that debt continues to pile up at an alarming rate (the debt rises), the accounts show that the quality of its revenues remains questionable as ever. 

It had already been reported that 2014 revenue rose by $33.5 million (+104% YOY), to $65.6 million. However, the accounts reveal two noteworthy features in the composition of this revenue increase. 

  • From note 2, page 53, it would appear that $12.5 million of the 2014 revenue increase of $33.5 million related to additional sales of terminals and other equipment. Hence, 37% of the increase in sales during 2014 did not relate to bandwidth but was in fact sales of kit.

Avanti revenue
Source: Note 2, 2014 Annual Report
  • From note 16, page 59, it seems that $9.4 million of the group's $21.0 million trade receivables balance relates to a long term receivable, whereby just 10% of the original balance has been paid and the remaining payment cycle runs over the next five years until 2019!

Avanti trade receivables and long term receivable
Source: Note 16, 2014 Annual Report
This is altogether odd.

Firstly, one would assume that this long term receivable probably relates to the sale of bandwidth. If it doesn't then it would suggest that a further $10.4 million of the 2014 sales increase did not relate to bandwidth, which on top of the $12.5 million additional sales in kit would suggest that 68% of the group's 2014 sales increase did not relate to bandwidth. That would be strange for a satellite company.    

However, if it does relate to bandwidth sales, then that suggests that the group has extended a credit of $9.4 million to a customer(s) with a payment term over five years. Why would that be the case, when the company has suggested that capacity should be sold out well before 2019?

Further, this is not the first time that Avanti has extended a loan or in this case a credit to a customer. With this credit the group receives semi-annual instalments of $1.04 million, whereby interest is paid at a rate of 5.25% per annum. Incidentally, why does Avanti borrow its own debt at 10% per annum and then offer credit at 5.25% per annum? If you recall, in 2011, the group extended a £9.1 million loan to a re-seller/customer, or "strategic partner" as Avanti termed it then. That was supposed to accrue interest at a rate of 7% per annum, although within six months, the "strategic partner" had defaulted and Avanti took control of it (still a space oddity).

What this all suggests is that from the $33.5 million in additional sales for 2014, that $12.5 million relates to sales of kit and a further $9.4 million (which may or may not be bandwidth related) is from sales whereby the full cash amount will not be collected for another five years. This equates to 65% of the group's 2014 sales increase. 

In terms of the quality of the group's receivables balance, uncertainty remains. As highlighted above, $9.4 million of the total $21.0 million trade receivables balance is a long term receivable whereby the next instalment is due in June 2015. Why this is held in the current assets section is uncertain. Nonetheless, $9.4 million of the total trade receivable balance is naturally not going to be past due or even 60+ days past due as the first instalment isn't due for collection until June next year. This means that of the remaining $11.6 million in receivables ($21.0 million less $9.4 million in long term receivables) that $3.14 million is 60+ days past due. That is 27% of the current trade receivables balance is 60+ days past due. As Avanti has itself prior acknowledged, "Generally when the balance becomes more than 60 days past its due date it is considered that the amount will not be fully recoverable." 

Avanti - ageing of receivables
Source: Note 21 b, 2014 Annual Report

It is also worth bearing in mind that $4.6 million of the original $25.6 million trade receivables balance was impaired with a provision. So, of the $16.2 million in original current trade receivables, it would appear that $7.7 million has been provisioned for or is unlikely to be fully recoverable. That is 48% of the original current trade receivables balance!!! 

And another thing ...
Avanti paid its auditor, KMPG, an additional $392,000 in "Audit related assurance services" during 2014. Well done KMPG.

Avanti - auditor remuneration
Source: Note 4, 2014 Annual Report
I remain short Avanti.

Disclaimer: The information, discussions or topics referred to on this blog should in no way be considered “advice” to buy or sell anything. The information which may be referred to is freely available in the public domain and where required the source of information is referenced to for verification. While every effort has been made to ensure the veracity of any information contained within this blog, the author accepts no responsibility for the accuracy of any information contained within this blog or for the sources of information which may be referred to. Readers are responsible for their own actions and interpretation of the information contained within this blog. 

Monday, 20 October 2014

Avanti (AVN) ... the debt rises

Monday 20th October 2014

I finally got round to reading Avanti's year end results to 30th June 2014 (released on 15th September 2014). And then I shorted some more stock. 

2014 was a major year for Avanti. Its revenue doubled, the net loss nearly doubled, net debt ballooned to $321.7 million, and backlog went nowhere. 


Revenue
Around this time last year, I took a look at the composition of its 2013 revenue, attempting to fathom the revenue level that was related to satellite capacity. A year down the line and revenue discovery remains somewhat opaque: 

  • Q4 2014 revenue was reported as $26.5 million, however, the statement warns that revenues in Q1 2015 "... are expected to be around the average of the last year, with new contracts driving into growth in subsequent quarters." Hence, Q1 2015 revenue is expected to be c. $16 million. This would imply a Q3 2014 to Q1 2015 revenue trend of $14 million, £26.5 million, $16 million. This is not altogether reassuring for a company with an interest bearing bond of $508 million and ambitions to raise a further $125 million in debt and $100 million in junior finance (most likely equity).
  • As compared to 2013, I find it even less clear what makes up this year's group revenue.

    Whereas in 2013 the list of other revenue sources included:
     
    Consulting revenue;
    ESA contract; 
    and kit. 

    This year has seen the following added to the mix:

    Contracting and building several cellular back-haul networks;
    A customer who has initiated an infrastructure project, which is of strategic importance to AVN (this was provided as the main reason for the increased debtors at the year end);
    and revenue where infrastructure has been disrupted by civil unrest.
          
Sticking with revenue, there should be some concern regarding its future:

  • For the first time that I'm aware, the credit quality of the backlog figure has been raised by the group. Within the "Finance and Operating Review", it is highlighted that:

    "Backlog has a mixture of companies with varying credit qualities."

    The company goes on to highlight that:

    "The average credit quality has improved over the last 18 months." 

    However, the fact that the prior backlog revenue declared for 2014 (as reported 10th July 2013) of £42 million or $69.2 (£42 million at $1.65) failed to fully come through, goes against the grain of the latter statement. I note that there was also the expectation that:

    "... orders under framework contracts (not included in backlog), new contracts and possible renewals (of contracts expiring between 2014 and 2016) [would be expected] to increase these numbers."

    This expectation didn't seem to come through as, overall, revenues fell short of what was in backlog last July. The other alternative is that backlog materially under-delivered. This may explain the disappearance of this KPI?!?
  • In the CFO's review, he notes that $26 million of backlog moved to revenue. However, we know that revenue included the construction of cellular backhaul networks, so the construction of networks must be - or have been - in backlog - how much is it? The key question is how much backlog is pure satellite revenue that is expected to earn adequate margins to service and repay the ballooning debt whilst leaving a return for equity holders?
  • Finally, when discussing Cost of Sales, Avanti reveals that 2014 revenue may have been somewhat bolstered by projects where it has acted as the prime contractor, and so taking 100% of the revenues and then paying out the costs of the secondary contractors. How "incremental" these sub contract costs and associated revenue were, would be interesting to know.
The Gross Loss
One would imagine that a satellite company has a significant fixed cost base. And yet Avanti's "Other cost of sales" line (excluding depreciation) has remained stubbornly high at around 60% for the last several quarters, even as sales have risen sharply. The flat margin may suggest that either a lot of the growth in revenue is not bandwidth related sales, or the bandwidth is earning less/costing more to deliver than expected. I would've though that there should have been a ramp up in margin by now if significant satellite capacity was being sold, and yet this has not been the case.

EBITDA
In the third bullet point of the company's "Financial Highlights", it mentions that it was "EBITDA positive for the full year for the first time." This is somewhat misleading and Paul Walsh, AVN's Chairman, should probably know better than to permit the statement as it was. The positive EBITDA was prior to the "non-cash share based payment charge" and after the addition of $5.3 million of an ex-gratia payment relating to HYLAS 2. Incidentally, in a legal sense "ex-gratia" is a payment made without the payer recognising any liability or legal obligation to the payee. Given that the builder of the HYLAS 2 satellite is the payer, and is also the builder of newly ordered HYLAS 4 satellite, perhaps there is some sort of jiggery pokery going on? Either way, it's not an ongoing profit so the company was not EBITDA positive in a prudent understanding. 

Moody's
A review of Moody's analysis of the high yield bond shows that, just 12 months prior, Moody's had been expecting sufficient positive EBITDA for FY 2014 to provide an adjusted leverage multiple of 10x EBITDA. As highlighted below, Moody's most recent report after the additional bond suggests that: 

"The change in outlook from positive to stable reflects our expectation that the additional investment to fund HYLAS 4 will weigh on free cash flow, increase debt levels and increase the time frame for deleveraging. Based on the increased amount of debt, we now estimate that Moody's adjusted leverage as at the year end 2014 will be significantly above 10x-our expectation at the closing of the transaction in October 2013."

Source: Moody's Global Credit Research - 23 June 2014

This is a worrying deterioration from forecast positive EBITDA at the time of the issue of the $370 million High Yield bond, to now actual negative EBITDA with $508 million in High Yielding debt. It may prove difficult to raise further capital at a similar rate of interest in the debt markets. Indeed as the chart below highlights, Avanti's existing debt has already begun to price down over recent months, so that it has dropped below par and is now yielding 10.5%.           


Price of Avanti debt
Source: Bloomberg
Yield on Avanti debt - gone above 10%
Source: Bloomberg

Non-controlling interests
We await the full year accounts, but the reported loss attributable to the non-controlling interest suggests that Filiago made another loss despite its significant valuation held on AVN's balance sheet. More on Filiago here. In the light of the group's enormous debt pile, the condition of Filiago is almost irrelevant, barring the fact that it provides a further example of a lack of transparency. 

Balance sheet
The capital structure of the group and its associated cost changed dramatically during 2014. The group made a noble effort to suggest that the change was due to the prior debt being "... overly restrictive in terms of the Group' growth aspirations." The facts look more to suggest that the replacement of the old loan with a new more punitive loan was essential, and quite possibly to stall the event of a default. 

As it is, gross debt has risen a whopping $204 million during 2014, to $517 million. Meanwhile, net debt now stands at $322 million (2013: $254 million) and the group's interest expense has risen to $39 million (2013: $6.5 million). That is some rise to allow for less restrictive terms to meet growth aspirations! 

*********************************************************************************

There were further red flags I could mention, however, there are already enough here to prompt me to increase my short. So I did.

Avanti's share price
Source: Bloomberg
Disclaimer: The information, discussions or topics referred to on this blog should in no way be considered “advice” to buy or sell anything. The information which may be referred to is freely available in the public domain and where required the source of information is referenced to for verification. While every effort has been made to ensure the veracity of any information contained within this blog, the author accepts no responsibility for the accuracy of any information contained within this blog or for the sources of information which may be referred to. Readers are responsible for their own actions and interpretation of the information contained within this blog. 
Thursday, 28 August 2014

Walgreen (WAG) ... medicinal grief?

Thursday 28th August 2014


I've bought a few $60 September Puts for 83 cents in the drugstore retailer, Walgreen (WAG, mkt cap $58bn). I reckon this decent value for a stock which looks a bit iffy. 

I happened to notice that WAG's CFO, Mr Wade Miquelon, recently walked, seemingly for over-guiding 2016 prospective EBIT by a hefty $1.1bn or c.16%. How one manages to make an error on that scale I do not know, but it's usually a precursor to matters getting worse before they get better; something is often going on in the background.

My target is $55 on a two to three week basis. Technically that would coincide with down channel support. The fact that WAG has gapped down on a grand scale through its 200 day moving average does also not bode well. Indeed the chart to me looks like it's setting up for a second service roll over.

Valuation wise WAG is still on a punchy 16.3x forward earnings; earnings which are still being downgraded. Indeed, WAG's historical forward P/E rating has typically been sub 14x in the six years prior to Q4 2013.

September $60 Puts at 83 cents ... could be a nice little 9/2 bet.

Walgreen - share price
Source: Bloomberg
Walgreen - longer term share price
Source: Bloomberg
Walgreen - consensus earnings downgraded
Source: Bloomberg
Walgreen - forward P/E and EV/EBITDA multiple
Source: Bloomberg
Disclaimer: The information, discussions or topics referred to on this blog should in no way be considered “advice” to buy or sell anything. The information which may be referred to is freely available in the public domain and where required the source of information is referenced to for verification. While every effort has been made to ensure the veracity of any information contained within this blog, the author accepts no responsibility for the accuracy of any information contained within this blog or for the sources of information which may be referred to. Readers are responsible for their own actions and interpretation of the information contained within this blog.